
Released on November 1st, 2013 by the Victoria Real Estate Board
VICTORIA BC – Greater Victoria continued to experience strong home sales during the month of October, reports the Victoria Real Estate Board (VREB). According to the Board’s MLS® System, 512 properties sold compared to 373 in October 2012, an increase of 37.27 per cent. There were 4,322 active listings.

“While we are all very pleased with the October results, we are tempering our enthusiasm,” says Shelley Mann, Board President. “After a slow market for the last half of 2012, we are still climbing back to previous annual sales numbers.”
Today, the VREB and joins the Canadian Real Estate Association and ten major real estate markets in Canada by adopting a new approach to the reporting of trends in residential property prices. Instead of relying on average and median sale prices which are subject to fluctuation, the Board moved to a new system called the MLS® Home Price Index (MLS® HPI). The methodology used by MLS® HPI has been endorsed by Statistics Canada, Canada Mortgage and Housing Corporation, the Bank of Canada, Finance Canada and Central 1 Credit Union.
At the heart of the MLS® HPI is the concept of the “benchmark” home, a notional home comprising the most common attributes of typical homes in a given area. Through the analysis of ten years of VREB MLS® sales data, MLS® HPI has defined benchmark homes for Greater Victoria as a whole as well as for each of our regions, districts and neighbourhoods. In each of these areas, MLS® HPI has defined a benchmark home for each category: single family homes, townhouses and condo apartments. Each month, VREB MLS® sales data will be fed into the MLS® HPI to calculate and track changes in the prices of our benchmark homes.
Benchmark prices are generally lower than corresponding medians and averages. MLS® HPI estimates the values of our typical homes, whereas medians and averages merely reflect the overall selling prices of the particular mix of homes that sold in a given month.
In a manner similar to the Consumer Price Index (CPI), MLS® HPI maintains a running index of the percentage change in benchmark prices. Like the CPI, the MLS® HPI assigns an index value of 100 to the benchmark prices at its starting point: January 2005. By tracking both benchmark prices and index values each month, MLS® HPI will provide a much clearer picture of real estate market trends in Greater Victoria.
“Past reporting of averages and medians showed flat pricing across the Board’s trading area but MLS® HPI indicates a moderate decline in prices in many markets over the last year,” Mann says. “Benchmark prices are flat month-over-month, and we will be watching very carefully to see where pricing goes.
“With average and median prices, it was often difficult to gauge whether prices of typical homes were rising or falling, but the HPI provides us with exactly this type of information,” she says.
For October 2013, the benchmark price for the Greater Victoria single family benchmark home was $485,400 and its corresponding MLS® HPI index value was 137.2. (This represents a 37.2 per cent increase since January 2005, when the index was 100). This benchmark price increased 0.15 per cent over the past month and decreased 3.18 per cent over the last year.
At the regional level, the benchmark price for the single family benchmark home in the Core municipalities was $547,800, a decrease of 0.56 per cent over the previous month and a 2.66 per cent decrease over October 2012. In Westshore, the benchmark price for the single family benchmark home was $410,600, a decrease of 0.37 per cent over September 2013 and 4.37 per cent decrease over October 2012. The benchmark price for the single family benchmark home on the Peninsula was $508,700 for September, an increase of 1.22 per cent over the previous month and a 3.56 per cent decrease year-over-year.
There were a total of 274 single family homes sold in September, an increase of 29 per cent over September 2012. September also saw the reporting of 126 condominium sales and 51 townhouse sales in Greater Victoria. Benchmark prices for the Greater Victoria condominium benchmark home and for the Greater Victoria townhouse benchmark home for September $283,100 and $393,100 respectively.
Total Waterfront Single Family Dwellings sold: 17, up 2 over October 2012
Total Non-waterfront Single Family Dwellings sold: 257, up 62 over October 2012
Single Family Dwellings sold over $1 million: 16 (1 over $2 million)
For more information on MLS®HPI benchmark prices and index values for September, visit www.vreb.org. Those requiring specific information on property values in their area should contact a REALTOR®. The Victoria Real Estate Board has 1,224 Members.
Published by the Victoria Real Estate Board October 2013
What is the MLS® HPI?
The MLS® Home Price Index (MLS® HPI) is one of several tools your REALTOR® uses to help you gain a solid understanding of the changes in home price trends and their impact on the market value of homes. Developed using data from the Multiple Listing Service System, the MLS® HPI is used to compare trends locally — for specific housing types and neighbourhoods — or across Vancouver Island, the Lower Mainland, and in most major cities in Canada. More importantly, it helps you approach one of life’s most important decisions – buying or selling a home – with greater confidence.
How Does the MLS® Housing Price Index Work?
The MLS® HPI can help you gauge changes in housing prices over time, including changes in: Overall home prices for the market as a whole. Prices for specific housing categories in a given area, or for the overall market. This information will help you to more accurately understand pricing trends in your local market area.
How is it Calculated?
The MLS® HPI concept is modeled after the Consumer Price Index, which measures the rate of price change for a basket of goods and services. A basket is the combination of goods and services that Canadians buy most such as food, clothing, transportation, etc. Instead of measuring goods and services, the MLS® HPI measures the rate at which housing prices change over time, taking into account the types of homes sold. The HPI uses a number of baskets representing benchmark homes. HPI identifies benchmark homes by using a set of quantitative and qualitative attributes that do not change over time, permitting apples-to-apples comparisons of price over time. These features together become the benchmark house, townhouse or apartment in a given area.
A benchmark property is designed to represent a typical residential property in a particular MLS® HPI housing market, such as Colwood, Oak Bay or Saanich. The MLS® HPI tracks changes in home prices by comparing price levels at a point in time with price levels in a base (reference) period. The base period value is always 100. For example, if the base period for single-family homes is 2005, and the MLS® HPI value for single-family homes in December 2011 is 149.1, you know that the value of single-family homes is up 49.1%, compared with 2005 (149.1 − 100 = 49.1%). While the HPI shows us the percentage change since 2005, the system also determines values for benchmark homes during the same period. The values produced by the system track the prices of benchmark homes over the same period of time.
How is the MLS® HPI different from average and median home price calculations?
The MLS® HPI is based on values assigned to various housing attributes, which tend to evolve gradually over time. This means that price changes calculated using the MLS® HPI are less volatile than those derived using common measures like average and median, which can swing dramatically in response to changes with high-end or low-end sales prices from month to month. It is often difficult to determine if average or median price fluctuations really reflect changes in buyers’ willingness to pay for certain housing attributes, or just changes in the volume of very expensive or inexpensive home sales from one time period to the next. The MLS® HPI removes that uncertainty.
Is the idea of a Home Price Index new to Canada?
A: An HPI is not new in Canada. The real estate boards of Greater Vancouver and Fraser Valley have had an HPI in place since 1996, when they hired economists to build a local housing price index for the BC Lower Mainland. The HPI has been widely recognized as providing the most accurate indication of housing price trends in those markets. The MLS® HPI has been in use since January 2012. The Victoria and Vancouver Island Real Estate Boards are joining eight other boards to collaboratively use MLS® data to track trends in home prices in markets across Canada. We are 10 partners and growing!
How often is the MLS® HPI published?
A: The MLS® HPI is published at or near the beginning of each month to reflect activity that occurred during the previous month.
Hope this was helpful. If you have any questions, or if you would like to know the benchmark price for your neighbourhood send me an email or give me a call.
Oct 1, 2013 – Released by the Victoria Real Estate Board
VICTORIA BC – Finishing up the strongest third quarter since 2009, the Victoria Real Estate Board reports that properly priced homes are selling which, along with reduced inventory levels, contributed to favourable market conditions. Q3 sales totalled 1,610, a year-over-year increase of nearly 15 per cent.
On a monthly scale, total real estate sales in Greater Victoria were up 16 per cent in September 2013 over September 2012. A total of 487 properties sold last month, finishing off a strong third quarter. Residential sales increased by 15 per cent year-over-year, while active listings decreased by 9.5 per cent year-over-year to 4,547.
“Last year at this time, sales volumes were being undermined by the amortization changes,” says Shelley Mann, Board President. “This year is following a more historic pattern. Properly priced homes are selling and as a result consumers are responding.”
Mann adds that while sales increased over the last four months, prices remained flat. “We don’t expect any significant price increases in the near future,” she says. “Our provincial economist noted that while unit sales are recovering, the weak economy bears watching.”
There were 279 single family homes sold in September, an increase of 29 per cent over September 2012, while the median price of $523,900 is up just over one per cent year over year from $517,500. There were 105 condominium sales with a median price of $271,500 and 60 townhomes sold at a median price of $352,750.
Total Waterfront Single Family Dwellings sold: 19, up 1 over September 2012
Total Non-waterfront Single Family Dwellings sold: 260, up 62 over September 2012
Single Family Dwellings sold over $1 million: 12 (1 over $4 million)


The Victoria Real Estate Board has published the sales statistics for September.

Real estate sales activity softened throughout Greater Victoria last month with a total of 458 homes and other properties selling through the Victoria Real Estate Board’s Multiple Listing Service® (MLS®), down from 542 sales in August. Sales last month were, however, 16 per cent higher than the 395 sales in September of last year. Prices, meantime, remained mixed depending on the property type.
Victoria Real Estate Board President, Dennis Fimrite, noted that the overall market remains stable despite some easing of sales in September. “There has been some softening in activity over the last year with sales so far this year running about 10 per cent below last year’s levels. However, sales during the last two months have been higher than in August and September of last year and we anticipate stable market conditions for the balance of this year.” Fimrite noted that despite economic uncertainty, interest rates remain very attractive and this is positive news for buyers. He added that that there were 17 single family home sales of over $1 million in September including one in Saanich East at over $6 million.
Fimrite added that the number of properties available for sale remained virtually unchanged last month with inventory levels currently 14 per cent higher than a year ago. “The number of properties available for sale declined very slightly last month to 4,940 compared to 4,944 at the end of August.”

The average price for single-family homes sold in Greater Victoria last month was $622,393, down from $652,841 in August. The median price also declined to $535,000 while the six-month average increased slightly to $622,519. The overall average price for condominiums last month was $332,490, down from $339,057 in August. The average for the last six months increased slightly to $331,209. The median price for condominiums in September also increased to $279,900. The average price of all townhomes sold last month showed little change at $436,039 compared to $437,079 in August. The median price declined to $391,000 while the six month average increased slightly to $447,127.
MLS® sales last month included 244 single family homes, 128 condominiums, 52 townhomes and 12 manufactured homes.
The stats are in. All in all August was a good month for real estate sales in Victoria. The median selling price on a single family home in Greater Victoria was $547, 000, the average was $652,841 and the six-month average was $621,960.

The overall average price for condominiums last month was $339,047, the six month average was $329,951 and the median was $271,500.
Sales were up from August last year with a total of 542 homes sold which is a great sign that our housing market is stable. While last month’s sales were strong overall inventory is still robust.

So what does this mean? If you’re a buyer this is a great time to get into the market. Interest rates remain low providing greater accessibility to the market place and lots of inventory means you’ve got more choices.
If you’re a seller be sure to put your best foot forward. Things like decluttering and staging your home can go a long way if you want to outperform your competition.

With so many for sale signs in our neighbourhoods and some lingering on lawns longer than others many sellers wonder; are we in a buyer’s market?
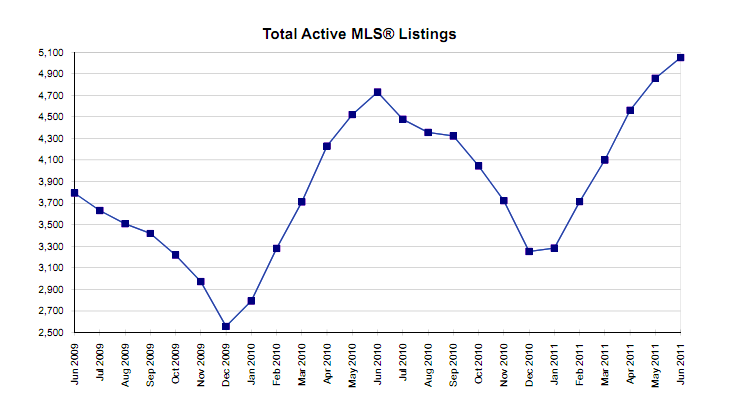
Actually market activity is more to the tune of a balanced market. In June, 618 homes and other properties were sold through the Multiple Listing Service — up from 572 sales in May and comparable to the 625 sales during June last year.

The Times Colonist published Tuesday July 4th, 2011 that the Victoria Real Estate Board inventory levels are currently seven per cent higher than they were at this point last year, and June’s 5,050 listed properties marked the highest monthly level in 15 years. This doesn’t mean that properties aren’t selling however this just means that there is more selection in inventory and that properties priced right will continue to attract buyers.

In the TC article Board President Dennis Fimrite affirmed that “In fact sales [in June] were stronger than in any other month this year. And the fundamentals in Victoria are so strong in that there is great weather, a good economy if prices start to soften you might see more buyers coming in or people buying property as investments.”

Firmrite also assured that even thought Royal Bank and TD raised their 5 yr fixed interest by 0.15 percent that market activity should remain healthy. “Yes, if rates go up it makes things less affordable, but there are a lot of people looking around who may buy because rates are going up.”

What all if this means to the home seller is that being competitive is important. With so much choice on the market making sure your property shows well is important. Turn on all the lights when you have a showing booked and of course make sure to de-clutter. If your property could use some elements like furniture in an empty space or complimentary decor consider staging.
Contact us for to have arranged an in home consultation to determine the value of your property and tips that will make you more competitive in today’s market.
Vancouver, BC – June 30, 2011.
The British Columbia Real Estate Association (BCREA) released its 2011 Second Quarter Housing Forecast today. BC Multiple Listing Service® (MLS®) residential sales are forecast to increase 5 per cent from 74,640 units in 2010 to 78,200 units this year, before increasing a further 3.1 per cent to 80,700 units in 2012.
“Home sales will post some modest gains over the next two years,” said Cameron Muir, BCREA Chief Economist. “However, positive housing fundamentals like job growth, rising wages and an expanding population base will be somewhat offset by higher borrowing costs over the next eighteen months.”
“Following a decade where unit sales broke all records, consumer demand over the next few years will be relatively moderate,” added Muir. The ten-year BC MLS® residential sales average is 87,000 units. A record 106,300 MLS® residential sales were recorded in 2005.
BC Home Sales Edge Lower in MayVancouver, BC – June 15, 2011.
The British Columbia Real Estate Association (BCREA) reports that Multiple Listing Service® (MLS®) residential unit sales in the province edged down one per cent to 7,857 units in May compared to the same month last year.

The average MLS® residential price climbed 20 per cent to $596,872 last month compared to May 2010.“Tighter mortgage rules, tepid employment growth and advance buying during the first quarter kept BC home sales on a lower note in May,” said Cameron Muir, BCREA Chief Economist. “However, recent downward pressure on mortgage interest rates is expected to provide some incentive to consumers over the summer months.”
Year-to-date, BC residential sales dollar volume increased 15 per cent to $20.1 billion, compared to the same period last year. Residential unit sales edged back one per cent to 34,191 units, while the average MLS® residential price rose 16.5 per cent to$588,857 over the same period.
*Courtesy of BCREA
The Canadian Mortgage and Housing Corporation (CMHC) is Canada’s national housing agency and provide excellent housing market information. Each quarter a report is made available that provides an overview of Victoria’s housing market, and the most recent report was made available today!
I wanted to provide you with some quick highlight of the report, and one of the available charts that is available online.
Victoria Highlights:
- the resale market is expected to remain in balanced territory(neither a seller’s nor buyer’s market)
- average resale prices will stabilize in 2011 and 2012
- MLS prices across all property types are projected to decrease by 2% in 2011, and then increase again in 2012 by about 1%
- the average price of single detached homes is projected to rise by 2.1% in 2011 compared to 2010
- the volume of MLS sales are projected to increase by 8.6% in 2011 compared to 2010
- economic and demographic factors will support possible housing demand in the region

Much more information is available online at CMHC or by contacting Patricia or myself. We would be happy to discuss future trends and today’s real estate market with you in more detail.
The Real Estate Board of Greater Victoria is an excellent resource for REALTORS and consumers to stay up to date with local stats. Each Monday the board releases an excellent summery of the month to date sales numbers.
Both Patricia and I believe that careful market research and analysis is the key to smart real estate investing and so we want to offer the below table as a resource for visitors to our blog. If you have any questions or would like more details information please contact us.
Here are the month-to-date number for this past week:

Affiliations

Let’s Connect:


